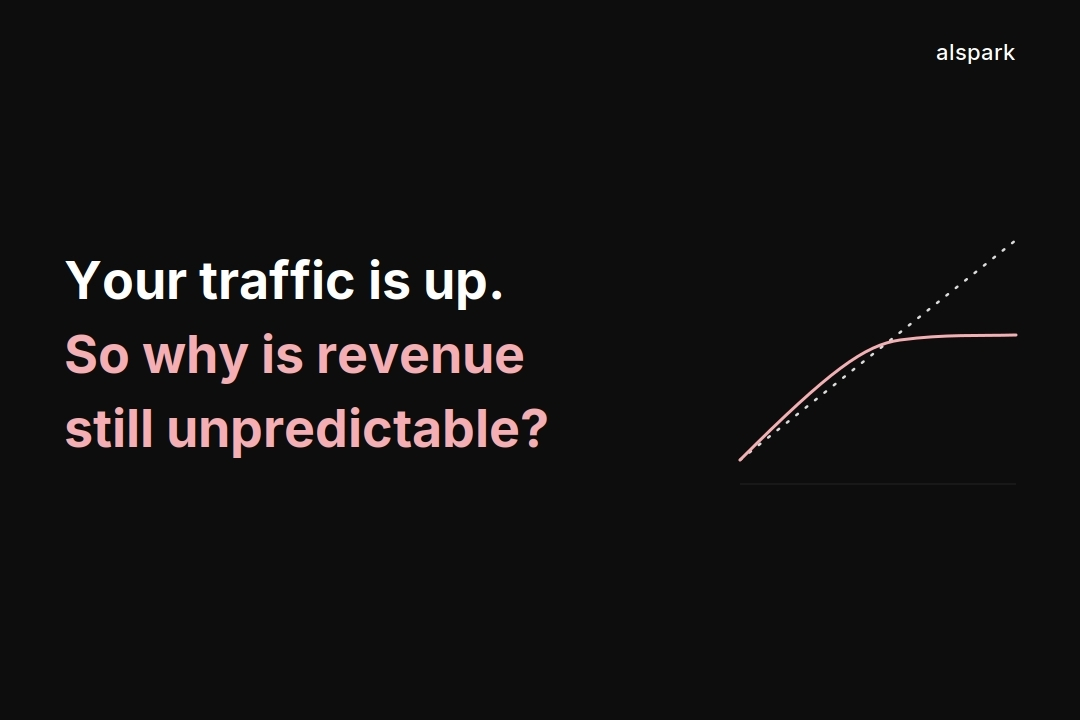
If you've ever sat in a meeting where your marketing agency proudly presents a 50% increase in website traffic while your CFO asks, “But what does that mean for revenue?” you've experienced the disconnect. Agencies measure activity. CFOs measure outcomes. And in today's B2B landscape, the outcome that matters most isn't traffic, it's revenue velocity.
Revenue velocity measures how quickly your pipeline converts into revenue. It's the rate at which deals move from lead to closed won, weighted by deal size and conversion efficiency. When you track revenue velocity, you shift from counting clicks to counting dollars. That's the language your CFO speaks.
According to Harvard Business Review, based on a survey of more than 500 senior revenue-driving leaders, companies with strong alignment across marketing, sales, and product are more than twice as likely to achieve rapid growth (39% vs 18%). This highlights that growth is driven not just by volume, but by how effectively the revenue engine operates as a coordinated system.
Meanwhile, Gartner predicts that by 2030, 75% of B2B buyers will prefer sales experiences that prioritise human interaction over AI, reinforcing the need for more buyer-centric revenue strategies. And McKinsey & Company highlights that the most effective CFOs focus on strategic value creation, acting as key partners to the CEO in driving growth and long-term performance.
This guide explains why revenue velocity is the metric that reframes the growth conversation, how to calculate it, and how to use it to align your agency, your sales team, and your CFO on the same revenue-focused page.
Traffic, leads, and pipeline value are easy to measure and easy to inflate. A new campaign can spike traffic without generating a single qualified opportunity. A sales team can fill the pipeline with low-probability deals that never close. Volume metrics create the illusion of progress while hiding the reality of stagnation.
Your CFO doesn't care about impressions. They care about cash flow, revenue predictability, and return on investment. When you present traffic numbers, you're speaking a foreign language. When you present revenue velocity, you're speaking their.
Revenue velocity is a simple but powerful formula:
Revenue Velocity = (Number of Opportunities × Win Rate × Average Deal Size) ÷ Sales Cycle Length
By incorporating win rate, this metric reflects not just how much pipeline you generate, but how efficiently it converts into revenue.
At its core, revenue velocity captures three drivers. How many opportunities you create, how valuable they are, and how quickly they convert. Improving any of these increases revenue velocity. Improving all three creates a compounding effect on growth.
More deals drive more revenue, but only when they are qualified. Focus on improving lead-to-opportunity conversion rather than simply increasing lead volume.
Larger deals increase revenue per close. This requires value-based pricing, stronger positioning, and disciplined packaging of your offerings.
Faster deal cycles improve cash flow and sales capacity. Reducing friction in your sales process, improving qualification, and clarifying value propositions all contribute to shorter cycles.
Choose a time period, count the number of closed deals, calculate your average deal size, and determine your average sales cycle length.
For example, if you closed 25 deals worth $250,000 in total over a 45-day cycle:
(25 × $10,000) ÷ 45 = $5,555 per day
This means your sales engine generates $5,555 in revenue per day. Improvements in deal size, conversion efficiency, or cycle time will directly increase this number.
When revenue velocity becomes the shared metric:
This alignment transforms disconnected activities into a coordinated system focused on revenue outcomes.
More leads or a larger pipeline do not guarantee growth. Focus on conversion rates, deal value, and cycle efficiency.
Low-value or low-probability deals inflate pipeline metrics but reduce overall performance. Balance volume with quality.
Different segments behave differently. Enterprise and SMB deals often vary in size and cycle length. Segmenting your velocity reveals where the real opportunities lie.
1. Strengthen Qualification
Use structured qualification approaches to ensure only high-quality opportunities enter your pipeline.
2. Adopt Value-Based Pricing
Align pricing with the outcomes you deliver. Increasing deal size has a direct impact on revenue velocity.
3. Streamline Your Sales Process
Identify bottlenecks and remove friction. Reducing cycle length directly increases revenue velocity when other factors remain constant.
4. Align Incentives Across Teams
Tie marketing, sales, and customer success to shared revenue outcomes rather than isolated metrics.
When you present revenue velocity to your CFO, you're not just showing numbers, you're showing understanding. You're demonstrating that you can connect marketing activity, sales execution, and financial outcomes into a single, measurable system.
Most B2B teams aren’t short on leads or activity. Pipeline looks healthy. Deals are moving. But revenue still feels inconsistent, hard to predict, and slower than it should be.
The issue isn’t volume, it’s how efficiently that volume converts into revenue. Without visibility into deal quality, conversion rates, and sales cycle speed, growth becomes guesswork instead of a system.
Revenue velocity brings clarity. It shows exactly where revenue is being created, delayed, or lost across your pipeline.
Ready to understand what’s really driving your revenue performance?
Book a Revenue Velocity Audit with alspark. We’ll break down your pipeline across deal size, conversion efficiency, and cycle length, identify the biggest constraints, and give you a clear, actionable plan to improve revenue predictability and growth.
There's no universal benchmark, it depends heavily on deal size and industry. What matters is your own trend: a number rising quarter over quarter beats comparing it against another company's.
The two terms are often used interchangeably and share the same formula. Some teams reserve “sales velocity” for the sales pipeline specifically, and “revenue velocity” for the leadership-level view across marketing, sales, and cash flow.
It depends on your sales cycle length:
• Monthly for most B2B service businesses
• Quarterly for longer, enterprise-style cycles
Yes, usually in one of two ways:
• Shortening the sales cycle through weaker qualification
• Inflating average deal size with one-off outliers
Segmenting the metric and reviewing it alongside win rate catches both.
Shortening sales cycle length usually shows results fastest. Increasing average deal size through pricing changes takes longer, since it depends on deals already in progress.
1. Harvard Business Review. Why Some Companies Grow Rapidly While Others Stall.
https://hbr.org/2026/02/why-some-companies-grow-rapidly-while-others-stall
2. Gartner. Gartner Says By 2030 that 75% of B2B Buyers Will Prefer Sales Experiences That Prioritize Human Interaction Over AI.
3. McKinsey & Company. The CMO's Comeback: Aligning the C-Suite to Drive Customer-Centric Growth.