
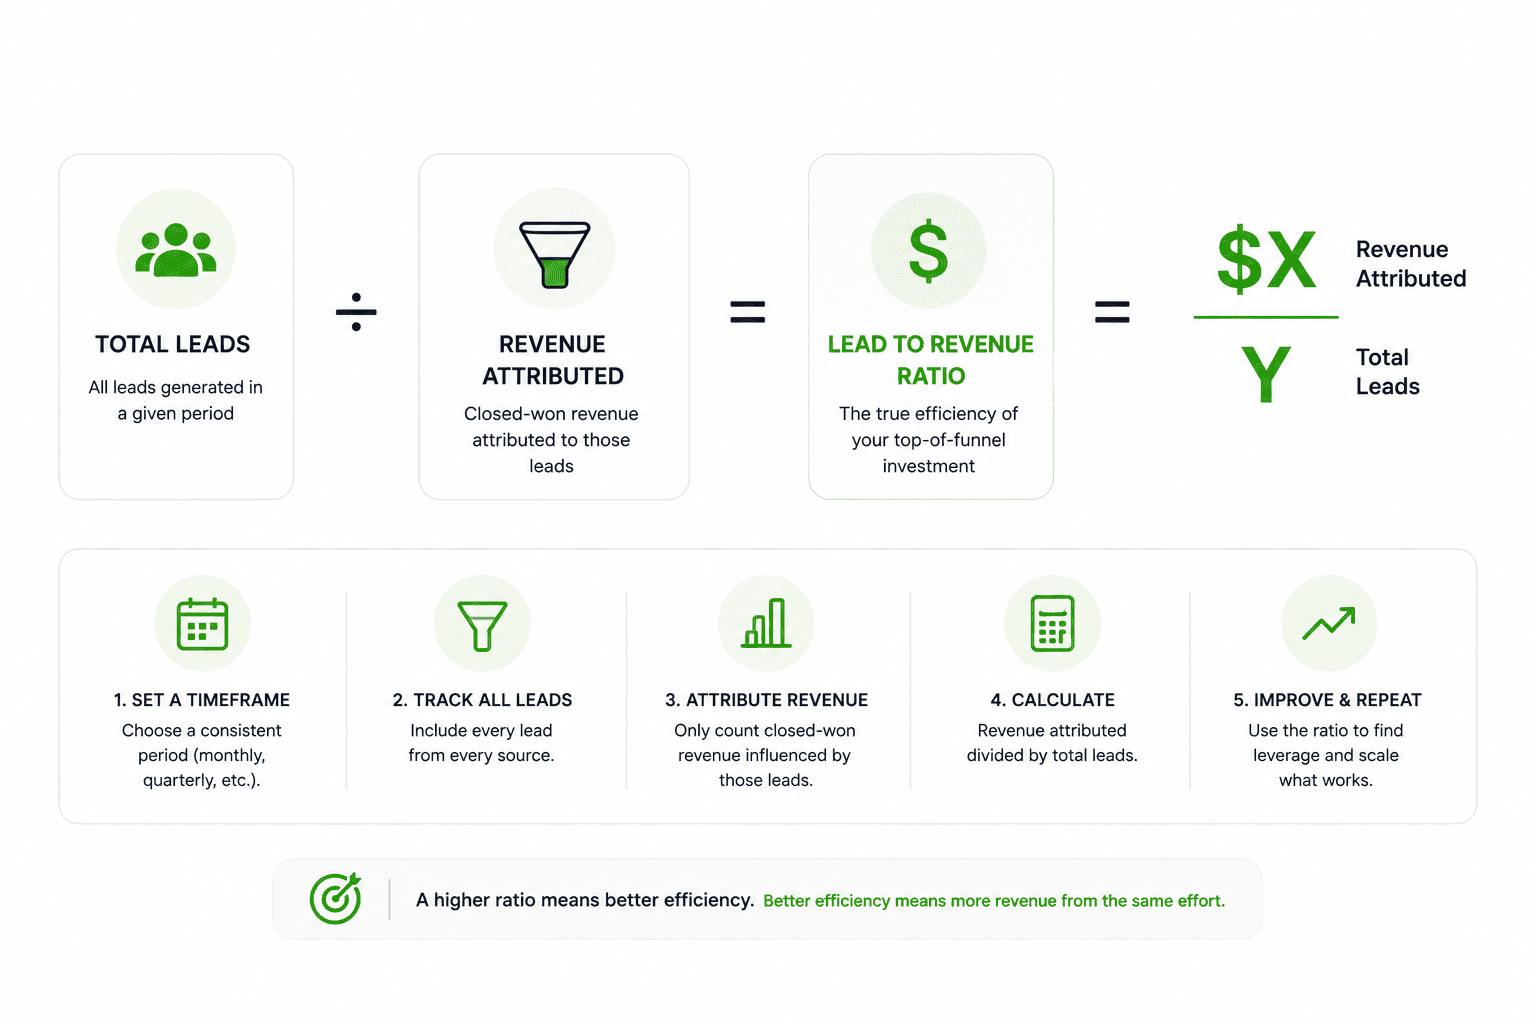
In the world of B2B growth, there is a metric that most teams track, but few truly understand: the lead-to-revenue ratio. On the surface, it seems simple: divide your total revenue by your total leads. But for serious operators, this surface-level calculation is not just incomplete; it's dangerous.
Most businesses operate with a 'vanity math' mindset. They celebrate high lead volumes while ignoring the structural leaks that drain revenue potential. If you don’t understand your true conversion math, you are not managing a growth engine. You are operating without clear visibility.
To build a predictable, scalable B2B firm, you must move beyond aggregate percentages and into the granular reality of how leads move through your funnel and convert into revenue.
The most common mistake B2B leaders make is relying on blended conversion rates. When you look at a single 'lead-to-close' percentage across your entire funnel, you lose the visibility required to make strategic adjustments.
As highlighted by SalesGlobe, many B2B organisations are struggling to translate increasing data and activity into meaningful revenue outcomes, exposing gaps in traditional go-to-market models. This disconnect often leads teams to rely on surface-level metrics that mask deeper inefficiencies.
A 5% lead-to-revenue ratio might look healthy on a spreadsheet, but it tells you nothing about the quality of the leads or the efficiency of the sales process. It can mask the reality that different channels often perform very differently. Some convert at a fraction of others. By blending them, you are effectively operating without clarity.
When conversion math is opaque, leadership cannot accurately forecast. This often leads teams to scale lead volume to solve what is actually a conversion problem.
To calculate your true ratio, you must break the funnel down into its constituent parts. The 'True Ratio' is a composite of three critical conversion gates.
This measures the alignment between marketing's definition of 'ready' and sales' definition of 'qualified.' If this ratio is low, your marketing spend is being wasted on unqualified leads.
This measures the sales team's ability to turn a qualified lead into a live deal. A drop here often indicates issues in discovery, qualification, or positioning.
The final hurdle. This is your win rate. According to Gartner, nearly 80% of B2B sales interactions between buyers and sellers are expected to take place via digital channels. This reinforces the need for accurate tracking and attribution across the entire funnel.
(MQL to SQL %) × (SQL to Opportunity %) × (Opportunity to Win %) = True Lead-to-Revenue Ratio
Consider two B2B service firms, both generating 1,000 leads per month.
At first glance, Firm A appears to outperform.
However, if Firm A’s average deal size is $10k and Firm B’s is $100k, Firm B generates $800k in revenue compared to Firm A’s $500k, despite closing fewer deals.
Without granular conversion visibility, Firm A may continue investing in low-quality lead sources, while Firm B can identify and optimise the exact levers that drive revenue.
Knowing the math is the first step. Fixing it is the second. At alspark, we use a Revenue Diagnostic Checklist to help operators identify exactly where their conversion engine is underperforming.
Stop looking at 'Total Leads.' Calculate conversion rates separately for inbound, outbound, referrals, and paid channels. In practice, different channels often perform differently. Aggregating them hides where your highest-value opportunities actually come from.
Where is the biggest drop-off? If it is between MQL and SQL, your lead qualification criteria may be misaligned. If it is between opportunity and win, your sales process, positioning, or pricing may need adjustment. Each drop-off point indicates where your conversion system is breaking down.
Revenue is not just about whether a lead converts, but how quickly it does. Faster conversion cycles improve overall revenue efficiency and forecasting accuracy.
Calculating your true lead-to-revenue ratio is not an accounting exercise. It is a strategic discipline. It forces visibility into how your pipeline actually functions and highlights inefficiencies that aggregate metrics hide.
Without precise measurement, conversion inefficiencies remain hidden and limit predictable growth.
Most B2B teams do not struggle with generating leads. They struggle with converting them.
Leads are coming in, but without clear visibility into how those leads move through each stage of the funnel, revenue becomes inconsistent and difficult to forecast.
The real opportunity is not to increase volume. It is to understand exactly where conversions break down and fix them.
Ready to see your true conversion performance?
Book a Revenue Diagnostic with alspark. We will break down your funnel stage by stage, identify where leads are dropping off, and help you build a conversion system that turns pipeline into predictable revenue.